Mastering Crypto Charts: Best Patterns for Smarter Trading Decisions
Embarking on the journey of cryptocurrency trading without a solid grasp of chart patterns is akin to navigating a complex maze blindfolded. For any serious trader aiming to decode the often-unpredictable digital asset markets, understanding the best cryptocurrency chart patterns to learn is not just an advantage—it's a fundamental necessity. This comprehensive guide will equip you with the essential knowledge to identify, interpret, and strategically leverage these powerful visual indicators, transforming raw price action into actionable insights. Dive deep into the world of technical analysis and discover how these patterns can sharpen your trading strategies, helping you anticipate potential market movements and make more informed decisions.
Understanding Crypto Chart Patterns: Why They Matter for Traders
At their core, crypto chart patterns are visual representations of supply and demand dynamics, reflecting the collective psychology of market participants. They are recurring formations on price charts that often signal potential future price movements. While no pattern guarantees an outcome, their historical reliability makes them indispensable tools for technical analysis. Unlike traditional markets, cryptocurrency markets operate 24/7, often exhibiting heightened volatility, which can amplify the significance of these patterns if interpreted correctly. Mastering them allows traders to:
- Identify Market Trends: Discern whether the market is consolidating, reversing, or continuing its current direction.
- Pinpoint Entry and Exit Points: Improve the timing of trades for optimal risk-reward ratios.
- Set Price Targets and Stop-Loss Levels: Use pattern-derived projections to manage risk effectively.
- Gain a Psychological Edge: Understand the prevailing sentiment (bullish or bearish) and anticipate shifts.
Successful pattern recognition is not merely about memorization; it's about understanding the underlying forces driving the price. Integrating volume analysis with pattern identification is crucial, as volume often confirms the strength and validity of a pattern's signal.
Essential Reversal Chart Patterns for Crypto Traders
Reversal patterns indicate a potential change in the prevailing market trend, signaling that an uptrend might be turning into a downtrend, or vice versa. Recognizing these early can be incredibly profitable.
Head and Shoulders (and Inverse Head and Shoulders)
The Head and Shoulders pattern is one of the most reliable bearish reversal patterns. It forms after an uptrend and consists of three peaks: a central, highest peak (the "head"), flanked by two lower peaks (the "shoulders"). A "neckline" connects the lows between these peaks. A break below this neckline, often accompanied by increased bearish signals and high volume, confirms the pattern and typically signals a significant downtrend. The price target is usually measured by the distance from the head's peak to the neckline, projected downwards from the breakout point.
- Inverse Head and Shoulders: This is the bullish counterpart, forming after a downtrend. It features three troughs, with the middle one being the lowest. A break above the neckline suggests a strong upward move. This is a powerful bullish signal.
- Practical Tip: Always wait for a confirmed breakout (clear break of the neckline with strong volume) before acting. False breakouts are common in volatile crypto markets.
Double Top and Double Bottom
These patterns signify strong reversals following sustained trends.
- Double Top: A bearish reversal pattern occurring after an uptrend. It consists of two consecutive peaks at roughly the same price level, separated by a moderate trough. It suggests that buyers tried twice to push the price higher but failed, indicating strong resistance levels. A breakdown below the low of the trough (the "neckline") confirms the pattern, signaling a potential downtrend.
- Double Bottom: The bullish equivalent, forming after a downtrend. Two consecutive troughs at similar price levels, separated by a moderate peak. It indicates that sellers tried twice to push the price lower but failed, suggesting strong support levels. A breakout above the peak's high confirms the pattern, pointing to an uptrend.
- Key Indicator: Volume often decreases during the formation of the second peak/trough, then increases significantly on the breakout.
Falling Wedge and Rising Wedge
Wedges are known for signaling reversals, though they can sometimes act as continuation patterns.
- Falling Wedge: A bullish reversal pattern formed by two converging downward-sloping trend lines. It indicates that selling pressure is diminishing. A breakout above the upper trend line, often with high volume, signals a potential upward reversal.
- Rising Wedge: A bearish reversal pattern formed by two converging upward-sloping trend lines. It suggests that buying pressure is weakening. A breakdown below the lower trend line, usually with increased volume, signals a potential downward reversal.
- Insight: These patterns suggest a contraction in price range and volatility before a decisive move.
Key Continuation Chart Patterns to Master
Continuation patterns suggest that the current market trend is likely to persist after a brief pause or consolidation period. They offer opportunities to join an existing trend or add to existing positions.
Flags and Pennants
Flags and pennants are short-term consolidation patterns that typically form after a sharp, nearly vertical price move (the "flagpole").
- Bullish Flag/Pennant: After a strong upward move, price consolidates in a small, rectangular (flag) or triangular (pennant) shape, typically sloping slightly downwards (flag) or horizontally (pennant). A breakout above the upper boundary signals a continuation of the uptrend.
- Bearish Flag/Pennant: After a strong downward move, price consolidates in a similar shape, often sloping slightly upwards (flag) or horizontally (pennant). A breakdown below the lower boundary signals a continuation of the downtrend.
- Volume Clues: Volume is usually low during the flag/pennant formation and surges on the breakout, confirming the continuation.
- Actionable Tip: The measured move for flags and pennants is often the length of the flagpole, projected from the breakout point.
Triangles (Ascending, Descending, Symmetrical)
Triangles are among the most common continuation patterns, though they can also lead to reversals.
- Ascending Triangle: A bullish pattern characterized by a flat top (resistance) and an upward-sloping bottom (higher lows). It indicates buying pressure is gradually overcoming selling pressure. A breakout above the flat resistance line, ideally with strong volume, signals an uptrend continuation.
- Descending Triangle: A bearish pattern with a flat bottom (support) and a downward-sloping top (lower highs). It suggests selling pressure is gradually overpowering buying pressure. A breakdown below the flat support line, often with increased volume, signals a downtrend continuation.
- Symmetrical Triangle: Formed by two converging trend lines (one sloping down, one sloping up). It represents indecision in the market, with neither buyers nor sellers in control. A breakout confirmation (up or down) from this pattern indicates the direction of the next significant move. Volume typically contracts during formation and expands on breakout.
- Strategic Insight: The longer the triangle's formation, the more significant the potential breakout.
Bilateral and Volatility Patterns: Navigating Uncertainty
Some patterns don't inherently lean bullish or bearish but rather indicate an impending significant move, the direction of which is determined by the breakout.
Rectangles (Trading Ranges)
A rectangle pattern forms when the price moves horizontally between two parallel support and resistance levels. This represents a period of consolidation where neither buyers nor sellers are dominant. The breakout from a rectangle can be in either direction, signaling a continuation of the prior trend or a reversal. Traders look for a definitive break of either the upper resistance or lower support, often with a surge in volume, to confirm the direction of the next move. This pattern is particularly useful for identifying clear price boundaries for setting stop-loss orders and profit targets.
Diamond Pattern
The diamond pattern is a relatively rare and complex reversal pattern, often found at market tops. It combines elements of a broadening formation and a symmetrical triangle. Price first expands in range, then contracts. A breakdown below the rightmost lower trendline typically signals a bearish reversal. Its inverse (diamond bottom) signals a bullish reversal. Due to its complexity and rarity, it demands careful confirmation and is generally considered an advanced pattern for experienced traders.
Actionable Strategies for Using Chart Patterns
Identifying patterns is just the first step. The real skill lies in integrating them into a robust trading strategy.
- Confirmation is Key: Never trade a pattern solely based on its formation. Always wait for a confirmed breakout or breakdown. This often means a clear close above/below the pattern's boundary, ideally with higher than average volume analysis.
- Combine with Other Indicators: Enhance reliability by using patterns in conjunction with other technical analysis tools like moving averages, RSI, MACD, or Bollinger Bands. For instance, a bullish pattern confirmed by an RSI divergence could be a stronger signal.
- Set Stop-Loss Orders: Every trade based on a pattern should have a defined stop-loss. For reversal patterns, place your stop just beyond the pattern's breakout point (e.g., above the head in a Head and Shoulders, or below the double bottom's low). For continuation patterns, stops can often be placed within the pattern's consolidation range. This is critical for effective risk management.
- Calculate Price Targets: Many patterns offer measured move targets. For example, the height of a triangle projected from its breakout point. While not guaranteed, these targets provide a guide for profit-taking.
- Consider Timeframes: Patterns observed on higher timeframes (e.g., daily or weekly charts) generally carry more weight and reliability than those on lower timeframes (e.g., 15-minute charts).
- Practice with Paper Trading: Before risking real capital, practice identifying and trading these patterns on a demo account. This builds confidence and hones your recognition skills without financial risk.
Beyond Patterns: Integrating Other Technical Indicators
While chart patterns offer profound insights into price action, their effectiveness significantly increases when combined with other elements of technical analysis. For instance, using volume analysis to confirm the strength of a breakout is paramount. A breakout without significant volume might be a false signal. Similarly, understanding support and resistance levels helps contextualize where patterns are forming. Is a bullish pattern forming at a key support level? This adds to its validity. Oscillators like the Relative Strength Index (RSI) or the Moving Average Convergence Divergence (MACD) can help identify overbought/oversold conditions or momentum shifts that align with a pattern's signal, providing further confluence. Remember, no single indicator is foolproof; a holistic approach enhances your edge and improves your trader psychology by building conviction in your analysis.
Frequently Asked Questions
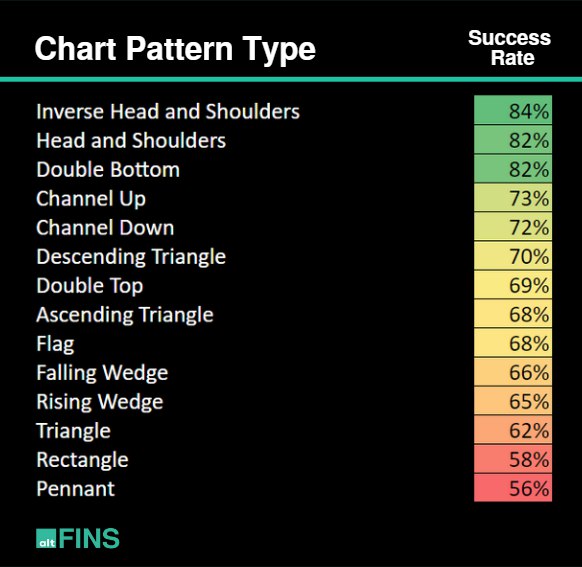
What is the most reliable cryptocurrency chart pattern?
While no pattern is 100% reliable, the Head and Shoulders (and its inverse) and Double Top/Bottom patterns are widely considered among the most reliable reversal patterns due to their clear formation and historical accuracy, especially when confirmed by significant volume analysis and a decisive breakout. These patterns provide strong bullish signals or bearish signals for potential trend changes.
How long does it take to learn crypto chart patterns?
Learning to recognize the basic shapes of crypto chart patterns can be relatively quick, perhaps a few weeks of dedicated study. However, mastering their application, understanding the nuances of their formation, and integrating them effectively into a profitable trading strategy takes consistent practice, observation, and experience in live markets. Developing strong trader psychology and disciplined risk management alongside pattern recognition is an ongoing process that can take months to years.
Can I use chart patterns for short-term crypto trading?
Yes, chart patterns can be used for short-term crypto trading (e.g., day trading or swing trading). However, patterns on lower timeframes (e.g., 1-hour, 15-minute charts) tend to be less reliable and more prone to false signals compared to those on higher timeframes (e.g., daily, weekly). It's crucial to combine them with strict risk management and potentially higher frequency confirmation signals due to increased volatility in shorter periods. Always confirm breakouts with strong volume.
What are the common mistakes when using crypto chart patterns?
Common mistakes include trading patterns without confirmation (e.g., anticipating a breakout before it happens), ignoring volume analysis, failing to set proper stop-loss orders for risk management, misinterpreting patterns, and focusing solely on patterns without considering the broader market trends or fundamental factors. Over-trading based on weak pattern signals is also a frequent pitfall that can lead to losses.
0 Komentar